LIVE-METEO help and support
If you need any help or want to get more information about this live-meteo system please contact our support team.
info@oceandrivers.com
About this product
This site provides real-time met-ocean information. It combines real-time and forecasts information. We have 3 sources of information:
- Land Stations: we get 24/7 information from different weather stations installed in different Marinas of the Bay of Palma.
- Forecast information: we use a 4 kilometers resolution model based on WRF for the Balearic area.
- EasyWind real-time: we install our EasyWind product. We install them in The Race committee with a 4G modem and deliver the data in real-time.
The data comes from live weather stations to cover the main sailing areas of the regatta also provide de information from the Race Committee.
- Real Club Náutico de Palma (RCNP): the data from this weather station is updated every 2 seconds.
- CN Arenal Sailing Club (CNA).: the data from this weather station is updated every 2 seconds.
- Club Marítimo San Antonio de la Playa (CMSAP).: this station updates the data every 10 seconds.
- Club Náutico Cala Gamba (CNCG): the data from this weather station is updated every 2 seconds.
The forecast
The forecast information is updated daily and it contains 2 days forecast. The spatial resolution is 4Km and the temporal resolution is hourly. The information is extracted from the OpenSkiron website. It uses WRF as a wind model forecast.

You can see a forecast for each of the racing areas
REAL-TIME stations
The real-time graph which dynamically displays the wind direction, relative to its mean value. Moreover, a wind intensity graph is represented to the left of the graph, which enables wind direction changes to be easily identified and related to wind intensity changes.
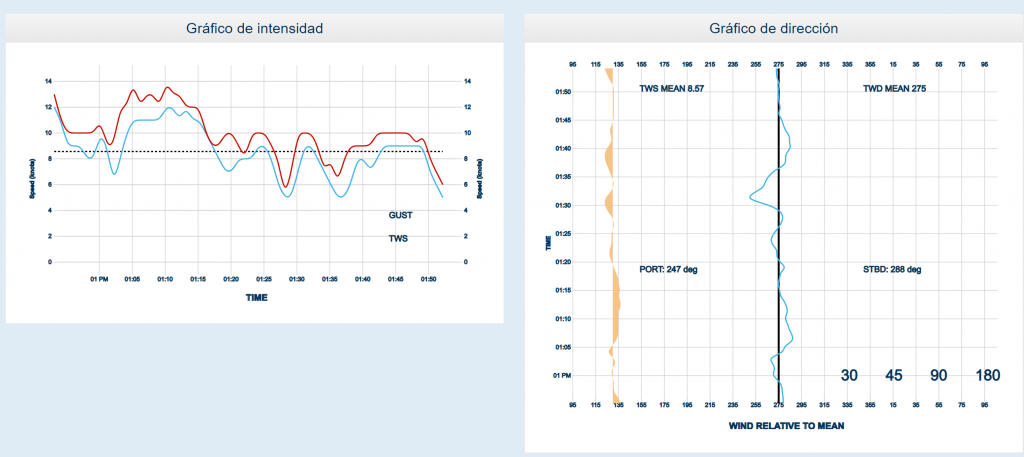
Wind direction graph
The real-time graph which dynamically displays the wind direction, relative to its mean value. Moreover, a wind intensity graph is represented to the left of the graph, which enables wind direction changes to be easily identified and related to wind intensity changes.
Default view for user is 180 direction angle. 30 | 45 | 90 views are also available, allowing the user to configure a different degree view upon a click. This is very useful according to the wind conditions. FOR EXAMPLE: If wind is stable, direction changes will need a closer look, and a 30 or 45 angle view may be necessary to appreciate wind shifts;. If on the contrary the wind is shifty a wider view may be needed.
Wind intensity graph
Real-time graph which graphically displays the wind and gust intensity, together with its mean value.
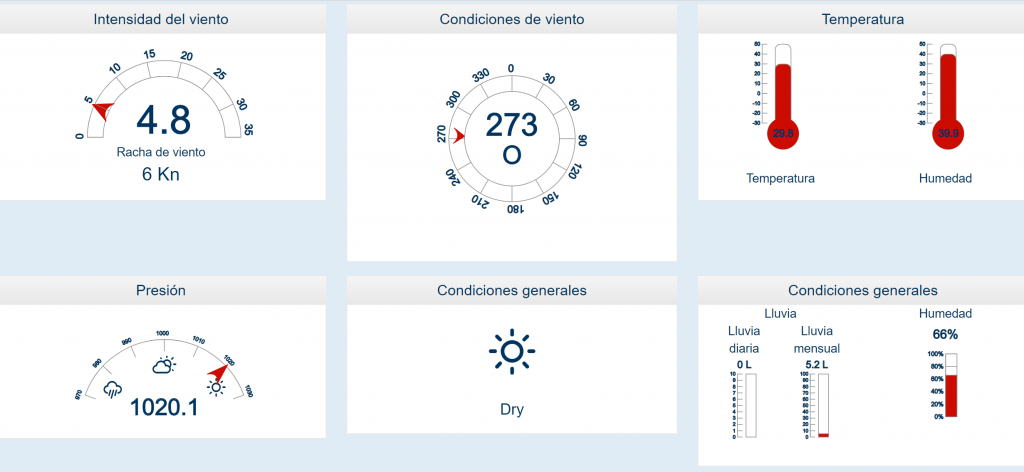
In the fixed weather stations you can see Wind direction and intensity. Temperature and humidity. The rain of the day, month and the pressure in a nice way.
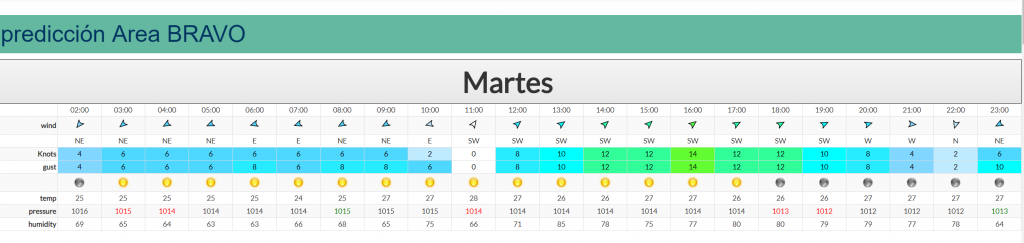
Compare
This section enables a user to compare the behavior of the current weather conditions vs the forecast predictions, allowing them to contrast predictions reliability. The forecast is presented in a table next to the real-time conditions in a visual interface.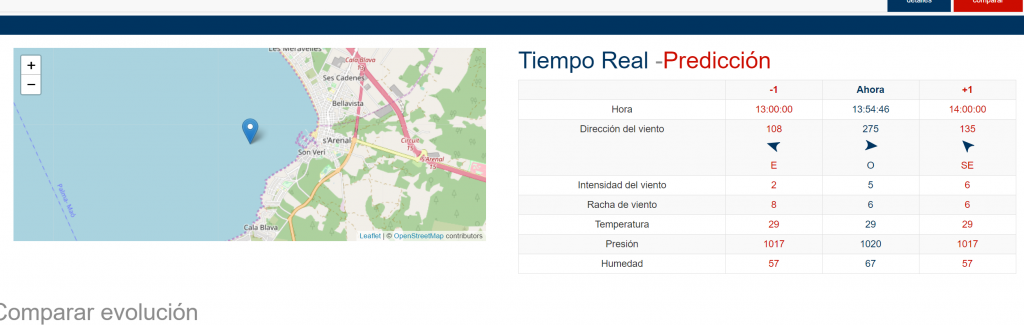
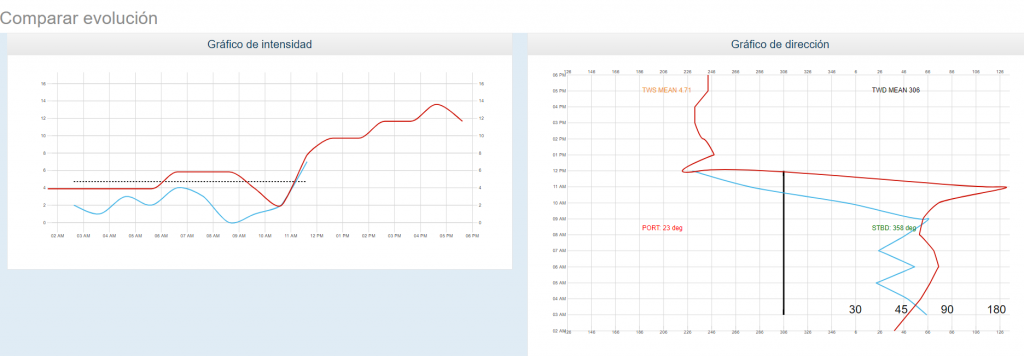
You can also compare in a graphical way the evolution of the wind intensity and the direction. This helps to understand is the Forecast is shifted. In blue, you have the data from the real-time measures and in red the forecast for the next couple of hours.
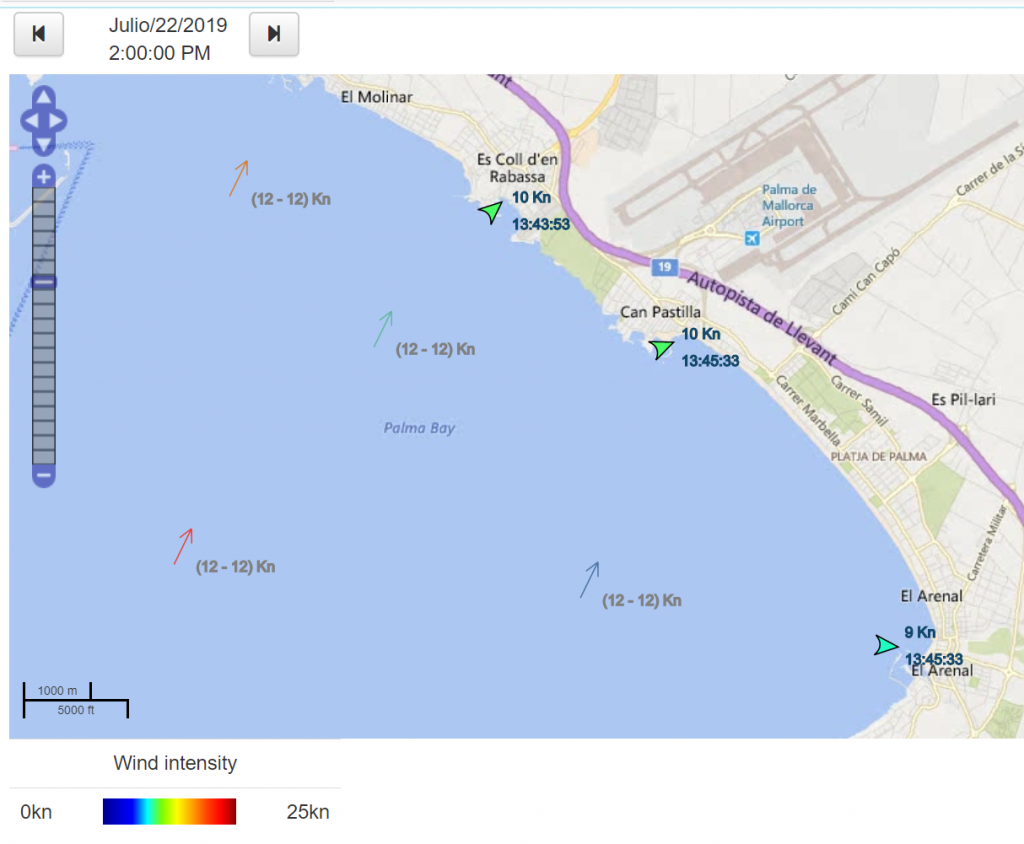
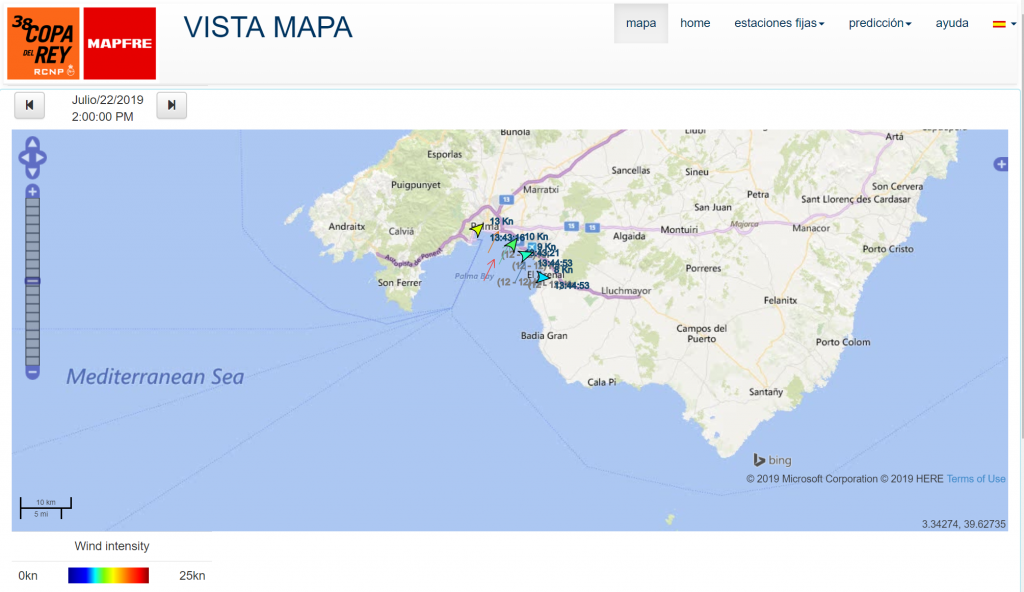
Map view
In the map view, you can see all the forecast information with the arrows not filled and the real-time stations with the colors representing the wind intensity. At the bottom you can see the legend with the color scale. Click on the arrows to see more details and information.
On the top right you can see the current time forecast that is displayed. Move the arrows to check the next forecast data.